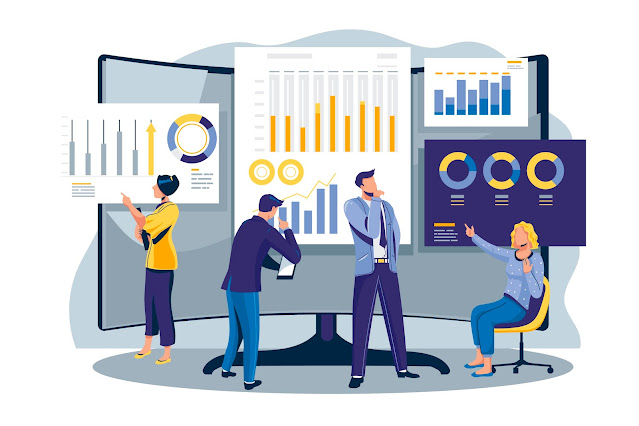
Event Analytics: The Advantages for Event Promotions.
The way event
organizers make decisions has changed dramatically thanks to event
analytics. Event organizers are more informed, and therefore the
decision-making process is more rational.
This article
will cover event analytics in depth and show how event organizers can make the
most of it.
Let's first
understand the different segments that event analytics can be divided into. These are the key aspects to consider when using
event analytics.
- Web analytics
- Audience Overview
- Content Overview
- Competitive advantage
Web
Analytics
This section
provides a summary of your event's performance. These KPIs provide a quantitative measurement of
the event's performance. These
are the insights that you can gain by smart use of dashboards
- Reach
Digital presence
is crucial to the success of face-to-face meetings, such as tradeshows, conferences, and events. This measurement can be done using web analytics. You can use features like impressions and page
views to measure the event's online reach.
- Engagement
Reach is only
one aspect of user interaction. The total number of impressions doesn't tell the
whole story. It's
a good idea to keep track of any additional actions taken by people who visit
the event listing. Connection requests are a sign of community
strength. Footfall
prediction can be aided by pre-event actions such as "interested" or
"going". Feedbacks
and ratings can also be used to monitor and manage event retention.
Audience
Overview
This section
provides a deeper understanding of the audience's behavioural patterns. This overview can be further segmented to reveal
more important insights. It
allows you to see which devices people use to interact with your event listing. Organisers use many channels to reach their
audience. Analytics
can help identify strong channels. The audience overview section provides a
comprehensive report on the event app and website. You can also determine the geographic distribution
of your audience.
These insights
can change from time to time. Interactive graphs make it easy to spot such
changes that occur over several days, weeks, or months.
Content
Overview
A listing of
events is broken down into sub-sections that range from about section to
exhibitor sections. Analytics
dashboard shows page views for all sections. This will help you identify the USP for your event. This also helps you to identify the sections that
need more improvisation.
This section
shows page visitors how they are responding to your content.
Similar to the
audience overview section you can also see the chronological changes in page
visitors' responses.
Competitive
advantage
To determine
where your event is in the industry, you will need to have additional industry
insight. This
section displays how your event ranks against other events. It is very competitive in the event industry. Many
events of a certain type compete for attention from a similar audience. This section of event analytics allows you to
position your event more attractively.
Event analytics
has made it easier for events to be digitally present. The event industry is not the same. Event organisers must ask one simple question:
"Does it meet industry standards?" Event analytics is more effective when it's
preceded and supported by rich data.
This
strategy is to ensure event analytics' relevance.
- It offers a CMS that
conforms to industry standards
- The CMS allows you to
create impactful content for three different platforms at once. These include the Eventalways.com website and personalised app for events, as well as the event
website.
- Event listing has a
significant impact on the reach. Eventalways is the largest event
discovery platform in the world with a rich database.
- Analytics dashboard Eventalways
gives you additional insights that can be used to improve your event
listing.

Comments
Post a Comment